
Geetha Iyer
“… if you are faced by a difficulty or a controversy in science, an ounce of algebra is worth a ton of verbal argument,” – J B S Haldane, biological scientist
Corona virus! A piece of RNA wrapped in a coat of proteins and fat is wreaking havoc on earth in a manner quite unfamiliar to lay humans! To understand its life-cycle, spread, infective rate and effect on human systems, epidemiologists, researchers, doctors, in short everyone in the scientific community is turning to maths! Can there be a better evidence of the importance of maths to life science – aka biology?
But high school or even middle school mathematics rarely use examples from the world of biology or highlight the close relationship between the two. I argue that it is the use of examples far removed from a child’s world that is responsible for the fear of maths. Experience is necessary to build knowledge. Knowledge reduces unknown fear. As COVID-19 spread its fangs (more precisely, its protein coat) it is math that very graphically (pun intended) has helped provide evidence of the gravity of the situation, so people could accept curfews and shut downs. Examples if sourced from the world of biology can provide experiences to a child that will help build mathematical knowledge.
The deep entwining of the two disciplines will become vivid if we examine our own life. Take a moment to dwell on the life of a human being from birth till the very last breath. It will make no sense without mathematics.
Maths in human lifetime
What is the weight of the new born baby? Has she doubled her birth weight at the end of three months? How many times do you nurse her? How many spoons of cereal powder to be added and to how much (i.e., what volume) water? How many teeth has she sprouted? Three years and the question moves to – how far is the school from your home? And then at school – How many fingers on each hand? How tall are you? How many slices of bread/idlis did you have for breakfast?
Get the picture? Life moves on the wheels of mathematics. Next when the young child – with an oversized bag on her back-enters school, the first lessons in maths use materials from the biological world. Seeds to make sense of numbers. I remember my lessons on odd and even. There were three different games using tamarind seeds or manjadi (Adenanthera pavonina1) seeds to master the concept. Games that I still love to play at 65. As we move into the teens it’s about how tall or how short, what size or weight, or all about calories in food!
When I catch the flu (or the dreaded COVID-19) the doctor reads the temperature. 102°C. Hmm. What medicine should I take? 2.5mg of Crocin. This tablet pack says 5mg. So take half a tablet. How easily the fraction is done isn’t it? Into middle age and attention shifts to questions of the heart, liver, etc. The blood pressure is 120/80 mm Hg but why is my heart beat more than 72 beats/minute? Lying in a hospital watching the doodles on the monitor, our mind is busy counting or calculating a number of things. Maths is with us till the very last breath. In agriculture, nutrition, cooking and medicine, math is the tool we use hardly being aware of it.
Biology’s influence on maths
From Aristotle to Francis Crick, biology has contributed immensely to the advancement of maths.
French mathematician Benoit Mandelbrot described fractal geometry by observing patterns in nature such as branches of trees, growth of plants, etc.
Robert Brown, the famous botanist discovered the Brownian motion while observing pollen grains suspended in water. Mathematical description for the motion developed by the American mathematician Weiner is an important part of the probability theory. The Weiner equation is used to study a variety of scientific processes. Mathematics has advanced in leaps and bounds through the study of nonlinear equations of diffusion influenced by processes from biology.
Cormack and Hounsfield received the Nobel Prize in physiology and medicine in 1979 for their theoretical mathematics that made possible image reconstruction by CT scan. MRI and PET are similar instances of humanity benefitting when mathematics and biological sciences twined.
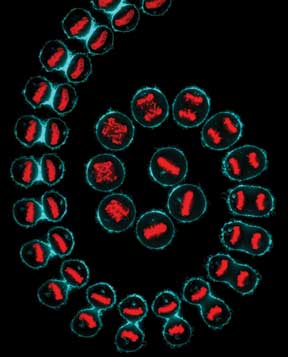 Fibonacci sequence or Fibonacci number is described as nature’s universal code. So common in nature, it may be seen in something as small as cells in organs image of cancer cells dividing, in the cells of the ovary of an Angler fish2 to something as large as inheritance patterns in humans. The number of petals in a flower, arrangement of rows of seeds in a sunflower, scales in a pine cone and the most famous of all – spirals in sea shells, nature has adopted this sequence of number so frequently leading one to wonder the reason behind it. Mathematicians believe that it facilitates efficient flow of information.
Although modern history attributes the discovery of this sequence to the Italian mathematician Leonardo Fibonacci, it was an ancient Indian Jain scholar, poet and polymath – Acharya Hemachandra3 – who described the Fibonacci sequence 50 years before the Italian. He discovered it while studying the rhythms of ancient Sanskrit poetry.
Geometry in life
Biological structures lend themselves to the study of geometry. A virus is nothing but a protein coat that encloses its genetic material. This coat often has complex geometrical shapes. For example, where the protein coat has a shape with 20 sides it is in the form of an icosahedral; some are helical. In the case of the corona virus it is spherical. Some plant cells have a very ordered hexagonal shape. Protozoan called Radiolaria that live in the sea are unicellular organisms but the geometry of their skeleton is amazing. Math teachers could use these examples while teaching geometry.
The field of topology is the mathematical study of shapes. Structures such as the brain fascinates mathematicians. Brain mapping uses hyperbolic and spherical geometry.
Fractal geometry. One of the most fascinating aspects of geometry of nature, observable in the branching patterns of trees, vascular tissues in our body, in shapes of all kinds in nature. Unfortunately neither biology nor math teachers talk about this in their classes.
Scutoid4 – Scientists and Engineers from three universities used principles of geometry to create a new shape called scutoid. They found out that this new shape was already in existence in nature long before they named it. When cells have to form an organ, they reshape and pack themselves closely, and the shape they take on is this geometric solid called scutoid.
Classroom examples
Primary math curriculum incorporates examples from the natural world. The same cannot be said for middle or high school math. As a student moves into middle school, math concepts increasingly require abstract visualization. Here is where difficulties begin for many. Examples from the biological world can assist in overcoming difficulties especially in topics from algebra and geometry.
Events from biological processes can be used to introduce a topic. Then data from these processes can be used for teaching or setting problems and equations to solve. Given below are a few samples – outlines of topics which should catch your pupil’s attention. (See the box below for more such exercises.)
The information given below may be used while teaching averages, percentages, decimal conversion, algebraic equations, weight-volume relationships, fractions, ratio and proportion, orders of magnitude and so on.
- A fun example would be this from the digestive system – Flatulence (or passing wind/farting) and burping are two processes that tickle children a lot. Maths problems related to these processes would not only serve to make math fun and easy to learn but also create awareness about food eaten.
- Here is some data calculated for an adult female aged 60+. Enjoy using them.
Info: Many chewing gums and some diet sodas contain sugar alcohol that can cause gas to build up in the intestine. While chewing gum, people tend to swallow air that can get trapped in the gut, leading to burping. Onions contain fructose which is broken down in the intestine. This breakdown causes gas to form with an odour.
Data: On an average human beings produce 0.47-1.41litre of gas/day and pass it out 18 times/day. The data may be used while teaching algebra.
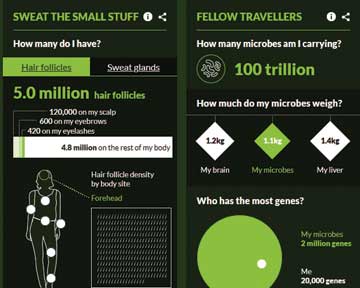
You can also feed in some basic information about yourself and find out what you are made of. Try it, it’s fun5.
A project for the class
Here is something that will make learning linear equations memorable. The example given below may be used separately or can be part of a project on linear equations.
Everyone studies biology till class 10 and therefore knows that William Harvey6 was responsible for the discovery of the circulation of blood. How he did is an interesting story, too long to be told here. He had no instruments or even anaesthesia to open the body and look at the functioning of the heart. He turned to mathematics. Through some careful measurements and calculations he was able to disprove the existing theory and explain how blood circulated in the body. The discovery and data he used can be a fascinating example for teaching linear equations.
Linear equation is the relationship between two or more variables. The relationship between the volume of blood pumped from the heart during each heart beat(V), the no. of heart beats per unit of time(R) and the amount of blood pumped by the heart through the body per unit of time (C)can be represented in a liner equation, C=V.R. This is what Harvey found out, calculated and estimated that the average human had only 5.5 litres of blood. (For more details on Harvey’s work refer to the TP website)
Teachers can give a value for cardiac output and then ask students to calculate the length of time taken for the entire volume of blood to circulate once through the body. This is the simplest one. Many more exercises are possible using data from the human cardiovascular system.
Examples from photosynthesis, respiration, heights of students compared with the lengths of their large bones may also be used for the project.
Ancient cultures did not fragment knowledge into sciences or mathematics. There was just one discipline called philosophy. These divisions came about as knowledge of the natural world increased. But, the time has come to dissolve some of these divisions.
In this emergent new society that seeks to inhabit the moon and mars, which is seeking to find extra-terrestrial life and produce human life in a petri-dish, biological sciences have entered an even greater exciting phase than when the human genome project began. Math is now a kind of microscope for biologists. It helps them discover the invisible in the world of living beings. When traditional laboratory experiments fail to find answers, biologists turn to math to model the systems that they are studying, such as loss of habitats, extinction events, brain functions, etc. Mathematical biology7 has emerged as a separate discipline in universities. Math curriculum at the high school too, must incorporate these developments. Education of students would be incomplete if they learn maths in isolation.
If mathematics and biology teachers are still not convinced of these connections, I recommend they read this most enlightening book by a mathematical biologist D’Arcy Wentworth Thompson titled On Growth and Form8.
References
- Adenantherapavonina: https://www.flowersofindia.net/catalog/slides/Red%20Bead%20Tree.html
- Cross section – anglerfish ovary: https://www.flickr.com/photos/nihgov/26211820793
- Acharya Hemachandra – https://en.wikipedia.org/wiki/Hemachandra#Mathematics
- Scutoid: https://medium.com/show-some-stempathy/redefining-geometry-in-biology-a6e6c0bd2abf
- http://www.bbc.com/earth/story/the-making-of-me-and-you#/
- Harvey demonstrating to King Charles, the circulation of blood: https://www.nationalgeographic.com/history/magazine/2018/01-02/history-william-harvey-medicine-heart/
- Mathematical Biology: http://www.scholarpedia.org/article/Mathematical_biology
- On Growth and Form: https://en.wikipedia.org/wiki/On_Growth_and_Form
The author is a consultant for science and environment education. She can be reached at scopsowl@gmail.com.
Fun problems for the classroom
The following data can be used while teaching or setting exercises on averages, percentages or decimal conversions.
The circulatory system fascinates children. Blood accounts for 7% of the human body weight.
- 5 litres of blood, red blood cells constitute 45% of whole blood, white cells 0.7 % and plasma -55.43%.
- 1ml of blood contains 4.2 -5.4 million RBC (female)/4.7 to 6.1 million RBC (male) –200,000 to 500,000 platelets; 4000-11000 WBC. These data can also be used in exercises to find averages.
- Under normal conditions of rest in a healthy adult human being, the percentage of oxygen in the pulmonary vein leaving the lungs is 98-99% and in the pulmonary artery that brings blood to the heart, it is 75%.
Orders of magnitude
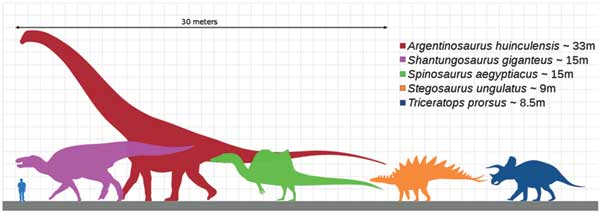
- The average human being can lift anything that is equal to his or her weight. You can have this verified as an introductory activity. A gorilla can lift 10 times her weight, an ant 100 times and a dung beetle 1000 times its weight. So a dung beetle is 1000 times as strong as a human.
- The sizes of various organisms can be used in the conversion of metric units, powers of ten. The following image can be used to set a variety of exercises, when teaching metric units that will interest students
Graphs: Growth curve of a growing baby, growing organs, a cancer cell or air pollution, rate of extinction of mammoths, dinosaurs, giant insects, rates of photosynthesis, etc., can be used while teaching exponential equation or in plotting graphs.
Rational functions: Calculations of Body Mass Index – BMI is weight in kilograms divided by height in metres squared. You can play with data here. For e.g., you can ask to calculate the maximum height a person considered obese will reach (given the weight of the obese person).
Trignometry to measure the height of a tree
Use trigonometry to measure the height of a tree.
You need a clinometer for this activity. A clinometer is easily made using a protractor to which you tape a piece of straw and then tape a string with a stone or heavy object tied to it. If in doubt see https://www.youtube.com/watch?v=FVqNEBWH4B0
Walk some distance away from the base of the tree. Measure this distance. Let us say, 50ft.
Using the clinometer, look through the straw and locate the tip of the tree. Hold the protractor steady and note the reading on the clinometer, i.e., where the string is touching the protractor. This is called the angle of elevation. Let’s say it is 30˚.
Calculate the height of the tree by using the formula tangent x= l/h where l is the distance from the tree to where you stood, h is the height of the tree and tan x is the tangent of angle of elevation which you can get from a calculator. In this case for 30˚, it is 0.577.
Substituting these value: 0.577 = 50/h or 0.577x 50 = h (height of the tree), which is 28.85ft.
This is the height from your eye level. To get the actual height measure your own height from the ground to your eye level. Assume it is 5ft, then the height of the tree will be 28.85+5 =33.85ft.
Watch this YouTube video to help you understand the activity better https://www.youtube.com/watch?v=hrwL3u2Z4Kg.
Discovery of the circulation of blood
Every student of biology learns that William Harvey discovered blood circulation. But how he did that is an interesting story rarely told in a biology class. Harvey was an accomplished practitioner of medicine, a Fellow of the Royal College of Physicians having obtained a degree of Doctor of Medicine from the University of Padua in Italy first and then from the University of Cambridge in England. He was appointed as Royal Physician first to King James I and then to his heir King Charles I. This position helped him gain access to a number of different animals (during hunting) which he dissected and studied. He performed both dissections and surgeries that further helped him observe the anatomy of organs inside humans and gain considerable knowledge of the workings of heart, arteries and veins.
He discovered the most accepted theory of his time put forward by the famous Galen, (an accomplished scholar and physician of second century AD) to be faulty. Galen’s theory was that blood was generated by the liver and carried to all parts of the body by the veins. Some of this blood when it came into contact with the air in the lungs would go into the artery (artery from the Greek word ‘arteria’ meaning that ‘which conveys air’) and heart and was lost. Arteries carried air not blood. No blood returned from anywhere to the liver, for it was considered that blood was consumed; it had to be constantly replenished by the liver. In other words, liver constantly produced blood.
Harvey’s first observation was about the function of the heart, arteries and veins. He found that the pulsation in arteries was related to the contraction of the left ventricles. Further, he noted that the two ventricles contracted simultaneously (and not independently) which pushed blood into the arteries. He demonstrated this not only in humans but in a variety of animals.
But the crowning glory of his work on circulation came with the aid of mathematics. He could not actually see how blood circulated in living humans. So he arrived at it through inference. How much blood could the heart hold, how many times did the heart beat in half an hour and what volume of blood was expelled during each time it pumped out blood.
From the data obtained through observations and various procedures he carried out with volunteers and cadavers he estimated that the heart had a capacity to contain a volume of 43ml (1.5 Imperial fluid ounce, which was the unit of measurement in his days) of blood. During each heartbeat, 1/8th of the blood was expelled; so he estimated that about 4.7ml (1/6th of the volume) circulated through the heart. He next estimated and found that the heart beat 1000 times per half hour. This meant that nearly 4.7 litres of blood was expelled every half hour, i.e., 14.1 litres in a day. He purposely kept his calculations on the lower side to answer his critics. By draining blood off a cadaver he estimated that the average human had only 5.5 litres of blood in his body.
With these calculations in hand, Harvey could disprove the existing theory that blood was produced in the liver. It was impossible for the liver to produce 14.1 litres of blood every day. Harvey argued that the quantity of blood is too great to be explained by movement in a single-path in veins in an open system and that blood must move in a circulatory pattern. Which meant that the blood circulated throughout the body via the two blood vessels. He then went on to demonstrate through a number of experiments that the blood circulated through the heart flowing in through the veins and out via the arteries. It was only through careful calculations that Harvey could discover the circulation of blood. Needless to say it was not easily accepted during his time as Galen was the accepted authority on medicine. Harvey had to face sceptics, criticism and even abuse. It took 20 years for his theory to find acceptance.
And finally who can forget Mendel’s experiments with the pea plant that laid the foundation for understanding inheritance. The ratios—3:1 (1:2:1) and 9:3:3:1— he obtained of the combinations of characters during breeding pea plants is legendary. If maths teachers used those real-time data from Mendel’s experiments for their lessons then surely math will not seem so insurmountable to students.